
10 Apr Home Prices Have Risen at Record Pace
 U.S. home prices rose 20% during the 12 months ending in August 2021 as buyer demand far exceeded the supply of dwellings for sale. This was the largest annual price increase in the history of the monthly S&P/Case-Shiller U.S. National Home Price Index going back to 1988. The index continued strong growth at a slightly slower pace in the fall, typically a time when the market takes a breather.
Home prices fell during most past recessions, but the housing market has been anything but normal since the pandemic began in 2020. In many cities, builders struggle to build enough homes to meet the demand driven by low interest rates, a desire for more space while working and schooling at home, and the aging of millennials into homeownership. This trend was amplified by labor shortages and spiking material costs in 2021.
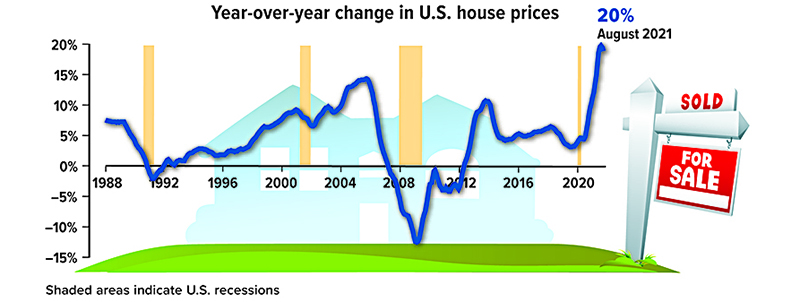
Sources: S&P Dow Jones Indices, 2021 (data for the period January 1988 to October 2021); The Wall Street Journal, July 27, 2021; National Association of Realtors, November 17, 2021
All investing involves risk, including the possible loss of principal, and there is no guarantee that any investment strategy will be successful.
This information was developed by Broadridge, an independent third party. It is general in nature, is not a complete statement of all information necessary for making an investment decision, and is not a recommendation or a solicitation to buy or sell any security. Investments and strategies mentioned may not be suitable for all investors. Past performance may not be indicative of future results.
Prepared by Broadridge Advisor Solutions Copyright 2022.